
Mastering labeling operations
In its simplest form, data labeling is the process of converting unstructured data to structured data, i.e. labeled data, used to train a machine learning model. For ML teams who are just starting on their journey, it may be unclear as to which metrics to focus on and improve when building out a data labeling pipeline. While labeling operations may seem like a fairly novel process, I’ve found that there are significant commonalities between these processes and those used in manufacturing — so much so that the three primary terms governing a labeling operation can be applied to both disciplines: throughput, efficiency, and quality (TEQ).
Before founding Labelbox, I spent years immersed in the field of aerodynamics, supporting the design, manufacturing and testing of complex aircraft such as the Boeing 787 Dreamliner. Through this vantage point, I came to understand the importance of TEQs in manufacturing. In recent years, I’ve worked with hundreds of leading AI teams and have found striking commonalies between labeling operations and manufacturing. And like manufacturing, I’ve observed that mastering the TEQs of a labeling operation translates into significant reductions in labeling costs, increases in data quality, and faster machine learning development.
Let’s first break down the TEQs and then we’ll bring them together and explore how to master them.
Throughput
Throughput is the amount of labeled data created by the labeling operation. In other words, it’s the volume of labeled data produced over a given period of time.
Estimating labeling project timelines requires measuring and forecasting throughput accurately. And this is often more complicated than measuring raw labeling throughput, as most labeling processes involve some amount of quality assurance, e.g. reviewing. To get an accurate understanding of throughput, we need to understand both labeling throughput and reviewing throughput. And to forecast throughput, we also need to predict if, and to what extent, labeling throughput will change over time.
As a rule of thumb, labeling throughput will increase by 30% or more in the first six weeks. This comes purely from improvements in productivity as labelers ramp up and get better at performing the labeling task.
The core metrics of throughput
- Label throughput and reviews (+ review score) throughput
- Time labeling, time reviewing, and total time
- Per labeler throughput
Label and review throughput
We start our assessment of a labeling operation by looking at the overall labeling throughput as well as the review throughput and their review score outcomes.
For labeling, we are assessing whether the labeling throughput is consistent with our expectations and if the average throughput will meet our timelines. We’re looking for anomalies here — whether it’s a marked surge or dip — as well as any trends, positive or negative, in the data. This will give us insight into how confident we are about estimating an average throughput as well as indicate potential issues in the labeling operation overall.
In the example below, there’s nothing anomalous in our labeling throughput, keeping in mind that June 13th is not a workday and June 15th is the current day.
And now turning our attention to review throughput, we want to ensure that:
- Reviews are not a bottleneck, and
- We monitor the frequency of approved and declined (rejected) reviews
In the example below, the review throughput is keeping up with label throughput, so we can safely assume that there are no bottlenecks. The scores from the reviews are also all approved, so we don’t currently have any reason to be concerned with the labeling operation based on this throughput analytic.
Label, review, and rework time
The total time spent labeling, reviewing, and reworking labels should roughly follow a similar pattern with the labeling and reviewing throughput data given constant labeling efficiency. Time is money, as most labeling is managed on an hourly rate. Using the total time data, we can quickly calculate our weekly cost for this labeling operation, which can be used for budgeting and forecasting purposes. Furthermore, the time spent over the last week should match our expectations based on the team size and time allocation to this work.
Efficiency
Efficiency is the ratio of throughput to the time (or cost) of work. In many ways, efficiency is the most instructive form of measurement for understanding and improving a labeling operation, both holistically and at an individual level. The key to using efficiency is establishing an efficiency benchmark: how much time should this labeling task take?
It’s tempting to just use the average across a group of labelers to establish an efficiency benchmark, but we’ll get better results by first understanding the efficiency outliers among the data labeling team.
- First identify the most efficient labelers — those that have the lowest average time per label
- If they are labeling faster and producing subpar work, then they should be retrained, because the time required to correct their work (known as rework) is significantly more time consuming than the time saved by their original labeling speed
- If the most efficient labelers have figured out a way to label faster while meeting quality standards, however, we should codify their method and propagate it to the rest of the labeling team
- Identify and retrain the slowest labelers in a similar manner
To ensure that our labeling operation reaches and maintains peak productivity and maximum cost-effectiveness, we need to regularly analyze efficiency data and take action where appropriate. While the traditional time-per-task metric calculates only the time it takes to create a complete, accurate label, it should also ideally include rework time and time spent per data row.
The core metrics of efficiency
When assessing labeling efficiency, we’re looking for anomalies and trends. The average time per label (also known as time per task or TPT) measures how long it takes an individual to complete the initial label. This is a direct measurement of labeling efficiency. In the example below, we see some variance in the average time per label as well as a slight downward trend. This is typical for a labeling operation, as labeling efficiency often improves 30% or more over the first six weeks.
The average time reviewing and reworking metric measures how long it takes an individual to perform a review and/or rework (edit) the label. Below, we also observe a decreasing trend, which likely indicates that the quality of the initial labeling work is improving and subsequently there is less review and rework time needed per label.
Overall, the data suggest that both the efficiency (and likely quality) of labeling is improving. We can also calculate the rework rate, which is about 8%, meaning that it takes just under one minute to review and rework (edit) labels for every ten minutes spent creating labels. The rework rate is calculated by dividing the review and rework time by the labeling time; in this case, it’s 1.5 minutes/19 minutes. An 8% rework rate is quite strong when compared to industry benchmarks (source).
Overall efficiency doesn’t tell the whole story, so let’s look at the individual efficiency data next.
Individual labeling efficiency: identify and correct
A quick look at the individual efficiency data shows that one of the labelers — labeler7 — appears to be twice as efficient as their peers. And further, they’ve only spent about three hours labeling. A difference in efficiency this large certainly warrants further analysis. To do so, let’s look at the time history data for labeler7.
Looking at the detailed analytics view for labeler7, we see that they are no longer working on this project. The blue line represents the individual’s data and the grey line represents the project average shown previously. The takeaway here is inherently situational. The most common scenario here is that labeler7 was not producing high-enough quality labels and has been reassigned. If that’s not the case, and labeler7 was producing quality labels with twice the efficiency, then it’s often prudent to study labeler7’s work and transfer their knowledge to others on the labeling team.
Let’s keep digging into individual performance by looking at the other two labelers’ detailed efficiency analytics.
Both labeler8 and labeler9 trace the project average within 5%. This is typical and a positive sign overall. As a general rule of thumb, consistency in labeling leads to more predictable labeled data outcomes.
Now that we have a comprehensive understanding of working with individual labeling efficiency, let’s do the same for individual review and rework efficiency.
Individual review & rework efficiency
There are three individuals engaged in review and rework activities here. Looking at the total time, we can readily infer that labeler1 is performing the bulk of the review and particularly the bulk of the rework. This is based on the assumption that reworking the labels is significantly more time-intensive than a binary (pass/fail) review.

Drilling down into the individual analytics for the two labelers validates our assumption. We see labeler1 performing the core reviewing and reworking while cyrus.heat is performing spot-check reviews of the work. This is a common practice among labeling teams where quality, in both accuracy and consistency, of the labeling work is critical.

Quality
Data quality is paramount for a successful AI initiative as any machine learning model is only as good as its training data. Quality is the trickiest of the three labeling operation metrics to manage, because it is subjective, both to the human eye and to the model. How good is good enough to produce the desired machine learning model performance, and how do we measure that? There’s no simple answer, rule of thumb, or formula for this. The secret to figuring out the level of quality appropriate for a desired machine learning model performance is iteration. Measuring quality starting with the first iteration is essential to iterating effectively. Quality is made up of two components: precision and accuracy. Both must be measured to paint the full picture.
Quality is the trickiest of the three labeling operation metrics to manage, because it is subjective, both to the human eye and to the model.
Precision, often referred to as consistency, is the measure of how similarly any two labelers will annotate the same asset (image, video, text, etc.). Precision is important because the machine learning model learns how to identify objects, categorize videos, interpret language, and so on through numerous, similar examples.
For example, if two labelers are annotating sunflowers and one labeler includes the stem in the annotation and the other does not, the model (when trained on this data) will have a weak signal about the relationship between a sunflower stem and its identification of a sunflower. Whether we want the model to identify sunflowers by their stems or not matters here, and in both cases, inconsistent labeling will reduce model performance.
Accuracy is the measure of how closely an asset is labeled in comparison to its ideal label. The ideal label is commonly referred to as its ground truth, or the benchmark label. The ramifications of inaccurate labeling are straightforward. Taking our sunflower example: if the sunflower annotations ought to include the stem (meaning that we want the model to identify a sunflower with its stem), and half of the annotations don’t include the stem, then the models ability to identify the whole sunflower (stem included) will be reduced.
A labeling operation can have varying, independent levels of both accuracy and precision. Labelers can consistently label a sunflower without the stem (high precision) for a task where the stem should be annotated (low accuracy), and vice versa.
The core metrics of Quality
Measuring precision and accuracy for a data labeling operation is both costly and critical. For precision, the most common technique used is consensus. A consensus system has two or more labelers annotate the same data asset and then compare their results.
To measure accuracy, a subset of the data being labeled is annotated by a domain expert and then marked as a benchmark. The assets marked as benchmarks are then presented to labelers to be annotated without the benchmark label shown, and their result is compared for accuracy against the benchmark label.
Consensus and benchmark systems allow you to automate consistency and accuracy tests.
To use consensus and benchmark tests effectively, we need to be able to customize the percentage of the data to test and the number of labelers that will annotate the test data. For many data scientists, discovering the best combination of quality tests for a labeling operation is often an iterative process in which clarity is gained through experimentation.
Benchmarks
To create a new Benchmark in Labelbox, browse to an existing label and choose ‘Add as benchmark’.

Labelers are tested against benchmark labels at random intervals. Here is an example analytic of benchmark test data for a labeling operation.
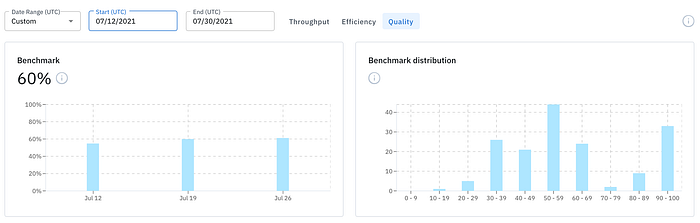
What we see here is a bi-modal distribution of benchmark test outcomes. That is, we see a cluster of benchmarks scoring centered around 50 and another cluster in the 90–100 range. This may or may not be concerning depending on what we expect to see. In any case, it indicates varying levels of labeling accuracy across the dataset.
The most common reasons for a non-normal distribution (i.e. bi-modal or otherwise) are:
- variation in label accuracy between individual labelers,
- different types of data and/or labeling tasks that vary within the data being labeled, and
- inconsistent or inadequate labeler training and proficiency for the task (often coinciding with new and unique data being added to an existing labeling operation).
Systemic poor labeler accuracy is often indicative of unclear or outdated instructions as well as inadequate training of the task for the (variety of) data being labeled. To remedy, investigate the low accuracy labels and ensure both the instructions and labeler training cover these cases.
Let’s dig deeper into this benchmark data by looking at the individual labelers benchmark scores.
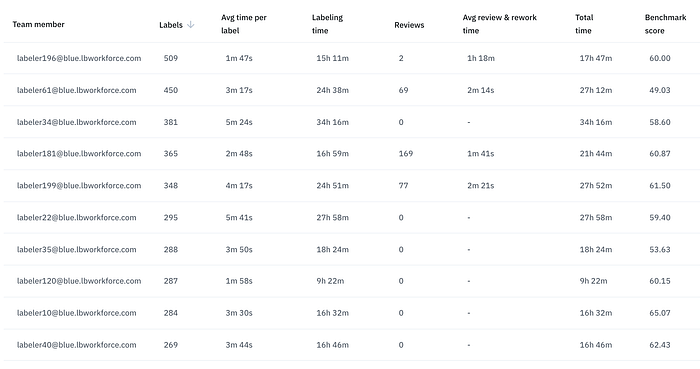
At first glance, we may wonder: where are the 90–100 benchmark scores? Well, the benchmark score for each labeler is the average benchmark. And this leads us to an insightful conclusion: there is consistent average benchmark scores across the labelers and therefore it’s highly likely that there is consistent variation (from 20 to 100 as we see in the distribution chart above) in benchmark scores. That is, there is a large variation of labeling accuracy for each labeler, and a small variation in labeling accuracy between labelers.
Large variation in accuracy for each labeler and a small variation in accuracy between labelers points us to variations in data and/or labeling task complexity as the cause for the bi-modal distribution of the benchmark test outcomes. This may or may not be what we expect, and if not, we can continue drilling down into the data to get to the answer. To learn more about how to do that and how to use Benchmarks in Labelbox, visit the docs.
Consensus
Consensus measures the rate of agreement between multiple labelers (human or machine).
How to use Consensus in Labelbox
- Enable consensus from the Settings of a Labelbox project, customize the consensus parameters and press confirm.
- Labelbox will automatically, and at random, distribute the desired percentage of data to be labeled across the labeling team with the overlap as configured in step 1.
- Keep track of overall consistency and investigate any dips in quality by looking into individual labeler and label consensus scores in the Performance → Quality view.
Here is an example analytic of consensus test data for a labeling operation.
On the left we see consistent consensus scores over multiple months of labeling, and on the right we see high consensus scores for a majority of the data, with a meaningful subset of outliers in the 50–70 range and in the 0–10 range.
We can follow a similar course of action to our process of working through the Benchmark data above to draw conclusions here about the cause of the outliers and to determine what, if any, action we need to take. To learn more about Consensus in Labelbox, visit the docs.
The TEQ dance
Knowing when and how to prioritize, measure, and manage each of the three aspects of a labeling operation — throughput, efficiency, and quality — is the untold secret among leading machine learning teams today. Getting this right comes from experience practicing an iterative, data-driven labeling operation. There’s no silver bullet, but here are some simplified example scenarios to consider:
- If your team is early in the development of a new machine learning model or in adding new capability to an existing one, you can accelerate development velocity through rapid iteration by focusing on throughput
- If your team is working on a tight budget and needs to increase labeling throughput, your best bet is to focus on efficiency
- If your team needs high-quality data to reach and/or maintain production level modeling performance, where a bad model prediction has consequences, focus on quality
Regardless of how you prioritize TEQ, your key initial step should be to ensure that you are measuring and tracking each of these metrics so that you can improve them over time and understand their tradeoffs. Properly monitoring the data labeling pipeline and data quality will vastly increase your chances of training a performant machine learning model from your first iteration and onwards. When teams create accurate labels the first time around — during the first quality pass — it is materially cheaper than discovering and redoing work to fix the problem.
Having helped hundreds of AI teams improve their training data pipelines, I’ve seen that the easiest way to get visibility and take control of this complex workflow is by using a training data platform. A training data platform will enable your team to measure TEQ metrics where all of your annotation and review processes are taking place — on a single unified platform. Labelbox was built to make the labeling operations process easier and to empower enterprise machine learning teams to speed up their model iteration and time to market. If you’re curious to learn more, please visit labelbox.com.

